
Large Language Model (LLM) observability is emerging as a critical discipline for anyone building AI-driven systems. Modern AI agents go beyond single prompts and LLM responses. They perform multi-step reasoning, call external tools, and make autonomous decisions, sometimes without explicit instructions at each step. This complexity introduces new failure modes that traditional monitoring doesn’t catch. An LLM might confidently produce a wrong answer, “hallucinate” facts, run up unexpectedly high token counts, or even loop endlessly through tools trying to solve a task. Without proper observability, these issues remain invisible until they harm user experience or incur high costs.
LLM observability extends the classic monitoring focus (e.g., uptime, CPU usage) into understanding why a model behaved a certain way. It involves capturing rich telemetry from LLM interactions, prompts, responses, tool calls, and intermediate decisions, so engineers can trace and explain the agent’s behavior. The goal is to detect problems early and pinpoint their root causes.
In this guide, we’ll define LLM observability, discuss why it matters, outline key challenges, and detail metrics and best practices. We’ll also highlight how Freeplay provides powerful LLM observability and evaluation capabilities to help teams build reliable AI systems.
What is LLM Observability?
LLM observability refers to gaining complete visibility into all layers of LLM-based systems, including prompts, model configurations, responses, and the contextual data that influences outputs. Unlike traditional application monitoring that focuses on infrastructure metrics and exception tracking, LLM observability must account for the qualitative and stochastic nature of AI outputs.
LLM observability goes beyond asking “Is the service up?” to asking “Why did the model respond that way?”
Traditional monitoring might tell you a service is running and response times are within limits, but it won’t tell you why an AI agent provided a faulty output or made a strange decision. LLM observability provides that deeper insight. By stitching together context-rich traces of each request, linking the prompt, the sequence of agent actions, intermediate events, and the final output, engineers can dig into specific model executions.
For example, if a model’s answer was incorrect, observability data can reveal whether it received irrelevant context, chose the wrong tool, or suffered from a poor prompt. In short, LLM observability is about making the “black box” of LLM reasoning transparent and auditable in production.
Why LLM Observability Matters
The economics and complexity of LLM applications make observability non-negotiable for production deployments. Organizations now face scenarios in which a single malformed prompt can cost thousands of dollars in API calls, or in which subtle model drift can degrade customer-facing features without triggering traditional alerts.
Key reasons LLM observability matters include:
Silent Reasoning Errors: An agent might return a grammatically confident answer that is factually wrong (a hallucination) or subtly irrelevant. Such errors won’t trigger traditional alarms since the service didn’t crash. Only observability that tracks output quality can detect these silent failures.
Autonomous Behavior & Tool Use: Agents now make decisions independently, including which tools or functions to invoke. Without observability, it’s unclear why a particular tool was chosen or what happened during those tool calls. You need to monitor the chain-of-thought and tool interactions to catch misuses or errors (e.g., the agent calling the wrong tool or using it improperly).
Compound Decision-Making: In multi-step reasoning, one bad decision can compound into larger failures. For instance, if an LLM-powered planner passes bad context to a downstream executor agent, the overall task fails. End-to-end tracing is needed to identify where in a chain things went wrong.
Drift and Evolving Performance: LLM responses can degrade over time as data distributions shift or as the model itself changes. Without tracking quality metrics and feedback over time, these regressions (model drift) might go unnoticed until they significantly impact users.
Cost and Efficiency Concerns: Autonomous agents might perform many needless actions, like calling an LLM repeatedly or using tools in loops, which can waste tokens and money. Observability is necessary to spot runaway costs (e.g., an agent stuck in a long loop burning API credits) before they accumulate.
Compliance and Trust: When models make important decisions (approving a transaction, providing medical advice), organizations need an audit trail for why those decisions were made. LLM observability provides traceability for each outcome, helping address regulatory compliance and build user trust.
LLM observability is vital because it lets teams detect issues early, before users are impacted or costs run up, and understand the root causes. Without it, teams are effectively flying blind. Hallucinations, bias, tool misuse, or slow degradation in quality might only be discovered after they’ve done damage. Observability brings these hidden behaviors to light so they can be fixed proactively.
Challenges in LLM Observability
Implementing effective observability for LLM applications presents unique technical and operational challenges that differ significantly from traditional software monitoring.
Tracing Nested Agent Workflows
AI agents often perform nested chains of actions. For example, an agent might generate a plan, call out to a search tool, then invoke another LLM with the found information. Tracing these multi-step, branching workflows end-to-end is difficult. Each sub-action (tool call or sub-agent invocation) needs to be instrumented and correlated to the overall request. Gaps in trace coverage can leave engineers guessing where a breakdown occurred in the chain. A robust observability setup must capture the entire tree of an agent’s steps as a single, linked trace.
Debugging Tool Calling Chains
Many advanced LLM applications rely on external tools and APIs (e.g., databases, web services). When an agent uses these tools, failures can happen outside the LLM itself. An API might return an error or a slow response. Observability for LLM agents means monitoring the tool call sequence and results. This is challenging because it requires instrumenting third-party integrations and handling asynchronous events.
Without collecting metrics and logs for tool usage (like which tool was called, latency, success/failure), developers struggle to debug why an agent’s action failed. Proper observability will trace each tool invocation as a sub-span with context (tool name, schema, result) and link it back to the agent’s decision that led to that call.
Understanding Autonomous Decision Paths
Unlike a hard-coded algorithm, an LLM’s reasoning process is not explicitly visible. It’s “locked” in the model’s hidden state and output text. Even when we enable an agent to print its chain of thought, the reasoning can be nonlinear or verbose. Gaining insight into why the model made a certain decision (e.g., why it answered a question a certain way, or why it chose a particular action) is inherently hard.
Observability needs to capture as much context as possible - the prompt and instructions given, intermediate thoughts if available, and the sequence of interactions. This often means capturing detailed logs at each step. The challenge is balancing completeness with signal-to-noise. Too little information - and the decision path remains a mystery. Too much unstructured log data - and it’s difficult to analyze. Finding the right observability pattern (such as logging structured events for each reasoning step) is non-trivial but necessary to make the agent’s thinking traceable.
Managing Observability at Scale (Multi-Agent Systems)
In real-world deployments, you may have multiple agents operating and interacting, or one agent handling thousands of concurrent sessions. Scaling observability to handle high volume and multiple actors adds overhead and complexity. For multi-agent ecosystems, an observability system must differentiate between agents and correlate events across them. Identifying which agent (or which interaction between agents) caused an issue is challenging without a robust correlation strategy.
Additionally, collecting telemetry from many agents or very chatty agents can produce huge data volumes, so storage, indexing, and noise filtering become practical concerns. There’s a trade-off between depth of insight and performance impact. Teams must design observability pipelines that capture rich data but remain efficient, perhaps by sampling intelligently or focusing on key metrics. Ensuring that instrumentation itself doesn’t slow down the agents is also critical (techniques like asynchronous logging or using independent observer processes can help).
Key LLM Observability Metrics
Effective LLM observability requires tracking both traditional operational metrics and AI-specific indicators of quality and behavior. Below, we share some common metrics that should be used in addition to business use-case specific metrics focused on your application and business logic.
Core LLM Metrics
Token Usage and Costs: Track prompt tokens, completion tokens, and total token consumption per request, aggregated by model, user, and feature. Monitor cost per interaction and establish budgets with alerts for anomalous spend patterns. Different models have vastly different cost profiles, making this essential for financial management.
Latency and Performance: Measure time-to-first-token (TTFT), total completion time, and streaming performance. Break down latency by component - model inference, prompt processing, tool execution, and data retrieval. Identify slow paths and optimize accordingly.
Error Rates and Types: Monitor API failures, rate limiting, timeout errors, and malformed responses. Track model-specific issues like content filter triggers or safety violations. Correlate error patterns with specific prompts or user behaviors.
Model and Parameter Tracking: Log model names, versions, and configuration parameters (temperature, top_p, max_tokens) for every request. This enables identifying when model updates cause behavioral changes and understanding which configurations drive the best results.
Agent-Specific Metrics
Tool Call Success Rates: Measure how often tool invocations succeed versus fail, which tools are used most frequently, and average execution duration per tool. Track patterns where agents repeatedly retry failed tools or abandon tool usage entirely.
Decision Path Tracing: Capture the sequence of LLM calls, tool invocations, and agent handoffs for each user request. Visualize branching logic and parallel execution. Identify common execution patterns and outlier behaviors that might indicate agent confusion or suboptimal reasoning.
Multi-Turn Coherence: For conversational agents, track context retention across turns, measure conversation length, and detect when agents lose track of conversation history or repeat themselves. Monitor how well agents maintain user intent throughout extended interactions.
Agent Loop Detection: Identify when agents enter infinite loops, retry cycles, or circular delegation patterns. These behaviors waste resources and indicate fundamental issues in agent design or prompt engineering.
Memory and State Management: For agents with memory, track what information is persisted, how memory influences decisions, and when stale or incorrect information in memory causes problems. Monitor state transitions in frameworks like LangGraph to understand agent progression through workflows.
Quality and Safety Metrics
Raw operational metrics tell you if your system is running, but not if it's producing good outputs. Production LLM applications require continuous quality evaluation to measure what actually matters: whether responses are accurate, safe, and accomplish user goals.
Quality Dimension | What It Measures | Why It Matters |
Accuracy & Factuality | Hallucinations, factual errors, citation accuracy | Incorrect information erodes user trust and creates liability |
Relevance & Coherence | On-topic responses, logical flow, instruction following | Off-topic or confused responses fail to solve user problems |
Safety & Compliance | Harmful content, PII leakage, policy violations, jailbreak attempts | Regulatory requirements and brand protection |
Task Completion | Did the agent accomplish the requested goal? | The ultimate measure of agent effectiveness |
Tone & Style | Brand voice alignment, appropriate formality | Critical for customer-facing applications |
Running evaluations online against live production traffic is essential for detecting quality degradation in real time. Unlike offline testing that only validates changes before deployment, online evals continuously monitor whether your production system maintains quality standards as usage patterns evolve, models drift, or external dependencies change.
Freeplay enables you to define custom evaluation criteria specific to your product domain and run them automatically against every production request (or sampled traffic for high-volume applications). Our platform supports model-graded evals for nuanced quality assessments, code-based evals for structured validation, and human review workflows when expert judgment is required.
These evaluations feed directly into monitoring dashboards and alert systems, so you detect quality issues before they impact users at scale. Explore Freeplay's evaluation capabilities to see how teams build comprehensive eval suites that align with their specific product requirements.
Best Practices for Implementing LLM Observability
Successful LLM observability requires both technical implementation and organizational practices that support continuous improvement.
Start with Lightweight Instrumentation
Begin by instrumenting basic observability into your LLM calls—log prompts, completions, model parameters, and timing. Many teams start with simple logging before graduating to specialized observability platforms. The key is establishing the habit of capturing data from day one, even if analysis comes later.
Use standardized formats where possible. OpenTelemetry semantic conventions for LLM operations provide a foundation that works across observability backends and prevents vendor lock-in.
Define Product-Specific Evaluation Criteria
Generic benchmarks like perplexity or BLEU scores don't tell you if your AI product is good. Define evaluation criteria specific to your use case: if you're building a coding assistant, measure whether generated code compiles and passes tests; if you're building a content moderation system, measure precision and recall against your policy definitions.
Freeplay lets you create eval suites that mirror real user scenarios. Use production logs to build test datasets that represent actual usage patterns, including edge cases and failure modes you've encountered. This grounds your evaluation in reality rather than synthetic benchmarks.
Implement Agent-Specific Observability Patterns
For agentic workflows, adopt observability patterns that match your architecture.
Hierarchical Tracing: Structure traces to represent parent-child relationships between agents. When a coordinator agent delegates to worker agents, the trace hierarchy should reflect that structure.
Decision Logging: Explicitly log agent planning steps and decision criteria. When an agent chooses a tool, log why it made that choice (even if that's just the model's explanation). This metadata becomes invaluable during debugging.
State Snapshots: Periodically capture agent state, including memory contents, context windows, and intermediate results. This enables post-hoc analysis of decision paths without requiring real-time debugging.
Tracing Strategies for Multi-Agent Systems
Multi-agent observability requires coordination across distributed components.
Correlation IDs: Use consistent identifiers that propagate across agent boundaries. Every sub-agent invocation should include context that ties it back to the originating user request.
Unified Data Models: Map diverse agent frameworks (LangGraph, CrewAI, OpenAI SDK) to a common observability schema. This enables comparing behavior across implementations and prevents siloed visibility.
Async-First Architecture: Design observability systems that handle high-throughput, event-driven agent communications without blocking agent execution or introducing latency.
Build Feedback Loops Between Observability and Development
Observability data should drive continuous improvement.
Production to Testing: Convert interesting production examples into test cases. When users report issues, extract those interactions and add them to your test suite.
Automated Regression Detection: Run eval suites against every prompt or model change; we call these Test Runs. Catch regressions before deployment rather than discovering them in production.
Data-Driven Iteration: Use observability insights to identify specific areas for improvement. If agents consistently make poor tool choices for a certain query type, that's a signal to adjust prompts or add a few-shot examples.
Collaborative Review: Enable domain experts to review LLM outputs alongside engineers. Subject matter experts can identify subtle quality issues that automated evals miss.
Establish Alerting and Incident Response
Define clear thresholds and alert conditions:
Cost anomalies (daily spend exceeding threshold)
Quality degradation (eval scores dropping below baseline)
Error rate spikes (sudden increase in failures)
Latency outliers (p99 latency exceeding SLA)
Agent loop detection (requests exceeding expected duration)
Create runbooks for common LLM issues. When an alert fires, teams should have clear procedures for investigation and mitigation.
Freeplay: Your Reliable Partner for LLM Observability and Improvement
Freeplay provides an end-to-end platform for teams building production AI applications. Unlike point solutions that focus only on monitoring or only on evaluation, Freeplay integrates observability, experimentation, and evaluation into a unified workflow that accelerates the path from prototype to production.
Comprehensive LLM Observability
Freeplay captures every LLM interaction across your application, from development through production. The observability dashboard provides instant search and filtering across millions of completions, with the ability to drill down into individual traces, inspect prompts and responses, and analyze system performance metrics.
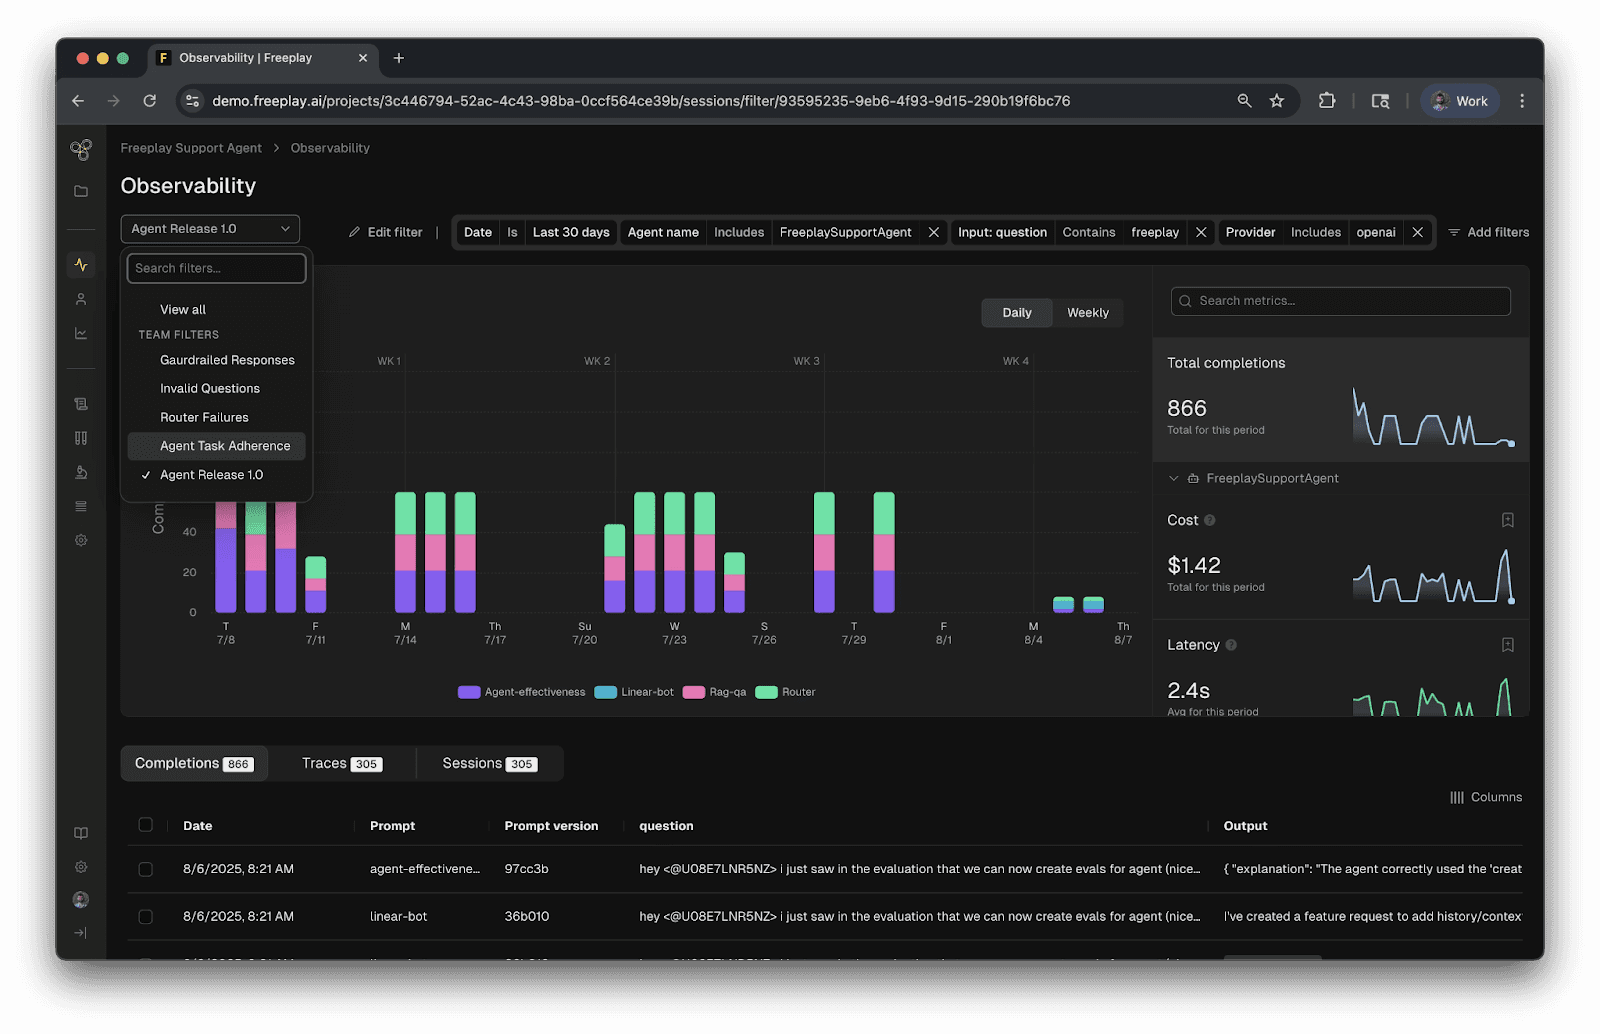
Freeplay’s LLM Observability Dashboard
Teams use Freeplay's observability to:
Debug production issues by replaying exact requests with full context
Identify quality patterns through custom filters and aggregations
Monitor costs and token usage across models, users, and features
Track agent behavior, including tool calls, decision paths, and multi-turn conversations
The platform supports complex agentic workflows with native integrations for frameworks like LangGraph, Google's Agent Development Kit (ADK), and Vercel AI SDK. This provides visibility into multi-agent systems without requiring custom instrumentation.
Evaluation at Scale
Freeplay enables teams to define custom evaluation criteria specific to their product domain. Create model-graded evals that use LLMs to assess quality dimensions like helpfulness, accuracy, or tone. Implement code-based evals for structured outputs, schema validation, or business logic checks. Run human evaluations when nuanced judgment is required.
Critically, Freeplay runs the same evals against both offline experiments and production logs. This creates consistency between testing and monitoring. Teams can detect production quality degradation using the exact same criteria they used to validate changes during development.
Experimentation and Testing Workflows
When teams want to update prompts, switch models, or adjust agent logic, Freeplay makes it easy to test changes before deployment. Create test datasets from production logs or curated examples. Run batch experiments comparing different prompt versions head-to-head. See exactly how each change impacts eval scores, costs, and latency.
The platform supports collaborative experimentation where engineers and domain experts work together. Subject matter experts can review LLM outputs, provide feedback, and help refine prompts - all without needing to write code or deploy changes themselves.
Prompt and Model Management
Freeplay manages prompt templates and model configurations as versioned artifacts that can be deployed like feature flags. Update prompts directly from the UI, test them against real examples, and deploy to production without code changes. This dramatically shortens iteration cycles compared to traditional development workflows, where prompt changes require pull requests and deploys.
Teams use Freeplay's prompt management to:
Version every prompt change with full audit history
Deploy prompt updates instantly across environments
A/B test different prompt strategies in production
Roll back problematic changes immediately
Enterprise-Ready Platform
For organizations with compliance, security, or scale requirements, Freeplay provides:
SOC 2 Type II and GDPR compliance with granular RBAC controls
Private deployment options (BYOC) to keep data in your cloud
High-throughput ingestion supporting hundreds of thousands of events per second
Lightweight SDKs that integrate without proxies or framework lock-in
Expert support from experienced AI engineers who understand production AI challenges
Freeplay transforms LLM development from reactive debugging to proactive quality management. Teams ship AI features faster, with confidence that they'll behave correctly in production and continue improving over time. Start building with Freeplay today or schedule a demo to see how we can accelerate your AI development workflow.
Final Thoughts on LLM Observability
LLM observability is no longer optional for production AI systems. Modern applications with autonomous agents and multi-step workflows require visibility into execution traces, continuous quality evaluation, and systematic improvement cycles. Without proper observability, teams debug blindly and struggle to maintain quality at scale.
AI agents amplify these challenges. When agents make autonomous decisions, invoke external tools, and coordinate across multiple systems, traditional monitoring falls short. Teams need visibility into agent reasoning paths, tool call success rates, and multi-agent coordination patterns - metrics that standard APM tools simply don't capture. Success requires using LLM observability tools like Freeplay, purpose-built for the unique demands of AI applications.
Read Freeplay's guides on the LLM evaluation and creating an effective evaluation suite for building better AI products.
FAQs About LLM Observability
Can LLM observability help detect hallucinations and drift?
Yes, but only if you pair telemetry with evaluation. Logs can show when a response changed; evals tell you whether it got worse. In production, you typically sample traffic, run model-graded or code-based checks for groundedness/factuality, and track trends over time. Freeplay supports running evaluations on production data (including model-graded evaluation and human review), which is the practical path to quantifying hallucinations and drift instead of debating them.
What are common mistakes when setting up observability for LLMs?
Common mistakes in LLM observability usually come from treating LLM systems like traditional services. Teams often measure only latency and error rates while ignoring output quality, which allows hallucinations and subtle failures to ship unnoticed. Another frequent issue is logging prompts and outputs without tracing retrieval steps and tool calls, leaving no causal chain to explain why a response was produced.
Many teams also fail to version-tag prompts, tools, and models, making it impossible to attribute regressions to a specific deployment. Agent-based systems commonly lack loop detection and step budgets, leading to runaway costs that appear without warning. Finally, skipping evaluations in production means model drift is discovered by users instead of being detected early through monitoring.
How does observability for multi-agent LLM workflows differ?
Observability for multi-agent LLM workflows differs mainly in correlation and causality. Instead of tracing a single execution path, you must observe how multiple autonomous agents delegate work, exchange state, and influence each other’s decisions. Failures often emerge at handoff boundaries rather than inside one agent, so observability needs to preserve parent–child trace relationships across agents and propagate shared correlation IDs to reconstruct the full distributed plan.
Multi-agent systems also introduce emergent behavior, such as feedback loops, conflicting actions, or redundant tool usage, which cannot be diagnosed by inspecting agents in isolation. Effective observability, therefore, tracks cross-agent decision paths, step counts, and loop signatures, alongside versioned prompts, tools, and models. Without this structured, system-level view, multi-agent failures appear nondeterministic, even when the root cause is a consistent coordination or routing issue.
First Published
Nov 5, 2025
Authors

Sam Browning
Categories
Industry
Product


